2007 H2 Mathematics
Paper 2 Question 11
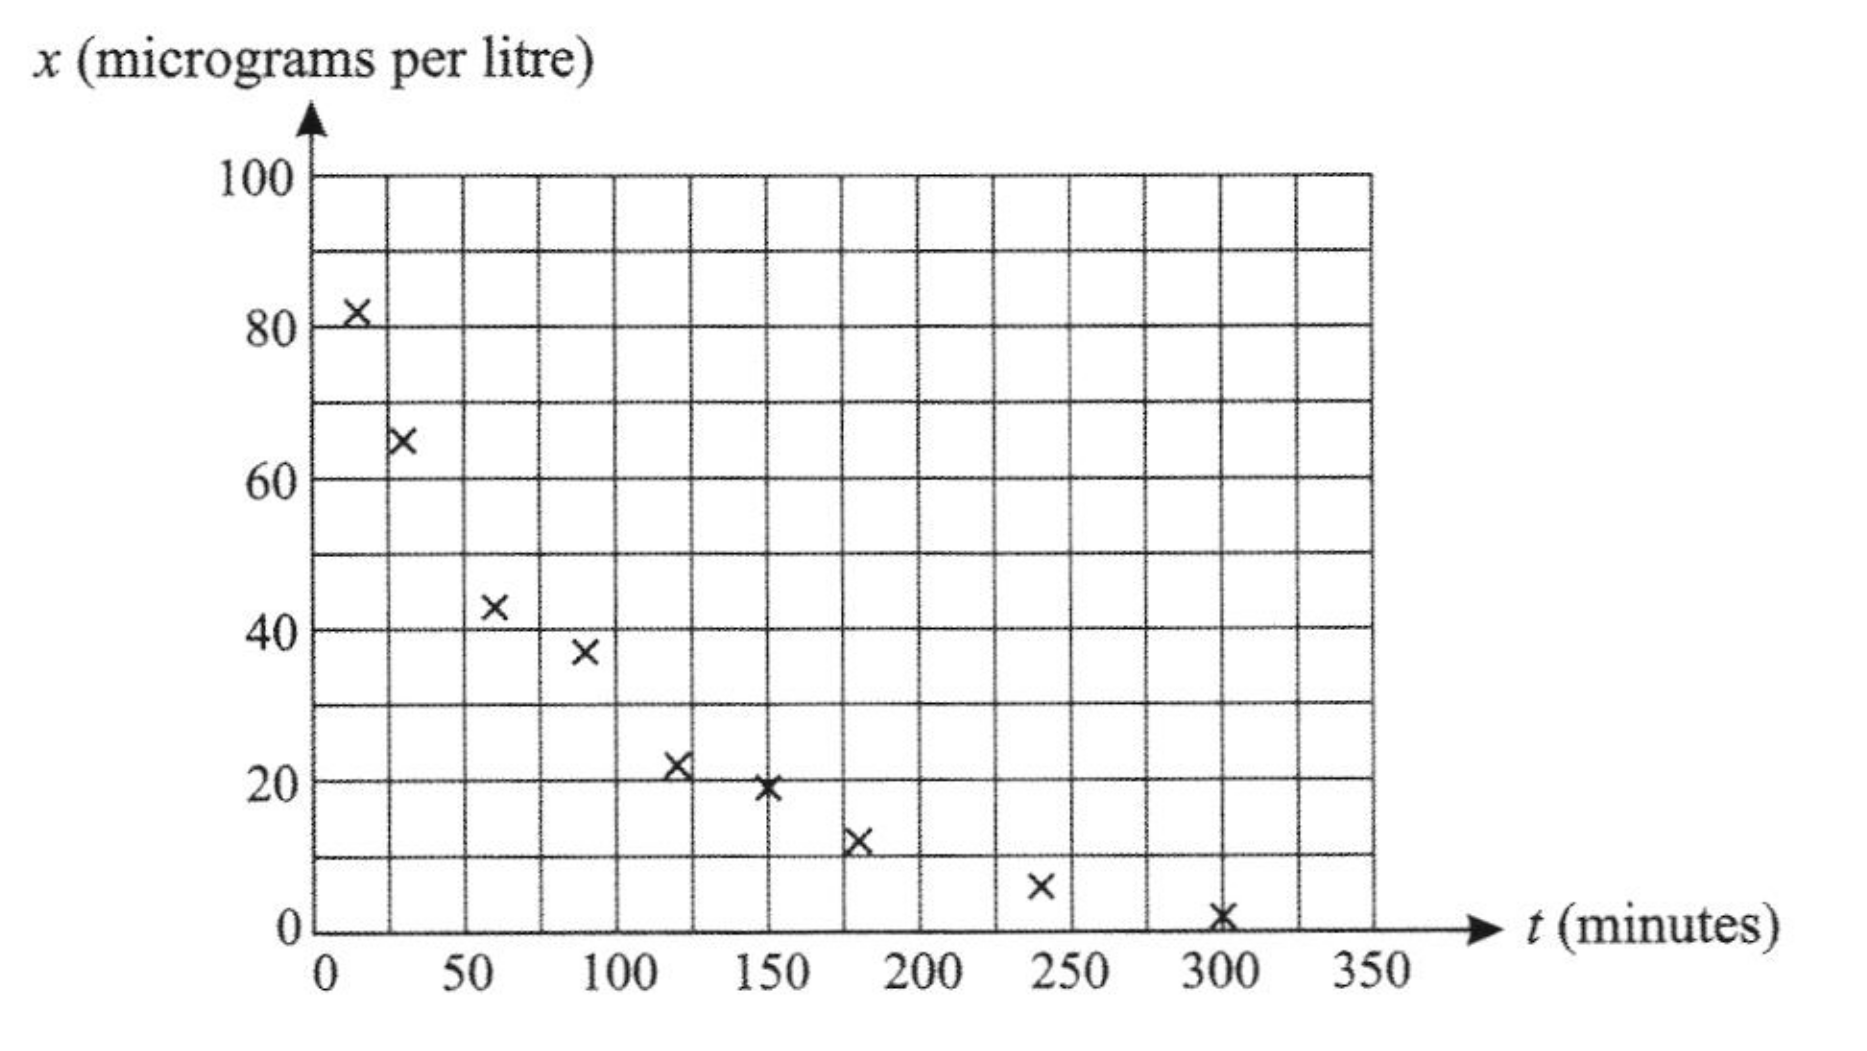
Research is being carried our into how the concentration of a drug in the bloodstream varies with time, measured from when the drug is given. Observations at successive times give the data shown in the following table.
| Time | 15 | 30 | 60 | 90 | 120 | 150 | 180 | 240 | 300 |
| Concentration | 82 | 65 | 43 | 37 | 22 | 19 | 12 | 6 | 2 |
It is given that the value of the product moment correlation coefficient for this data is correct to decimal places. The scatter diagram for the data is shown below.

Calculate the equation of the regression line of on
Calculate the corresponding estimated value of when and comment on the suitability of the linear mode.
The variable is defined by For the variables and
calculate the product moment correlation coefficient and comment on its value,
calculate the equation of the appropriate regression line.
Use a regression line to give the best estimate that you can of the time when the drug concentration is micrograms per litre.