Piecewise functions
Adapted from OpenStax Calculus Volume 11
Introduction
Sometimes a function is defined by different formulas on different parts of its domain. A function with this property is a piecewise function.
We will use the following example to better understand how to work with piecewise functions.
Evaluating piecewise functions
To evaluate a piecewise function (e.g. find the value of ), we use the appropriate formula (the “piece”) based on the part of the domain the value of is in.
For example, and
Graphing piecewise functions
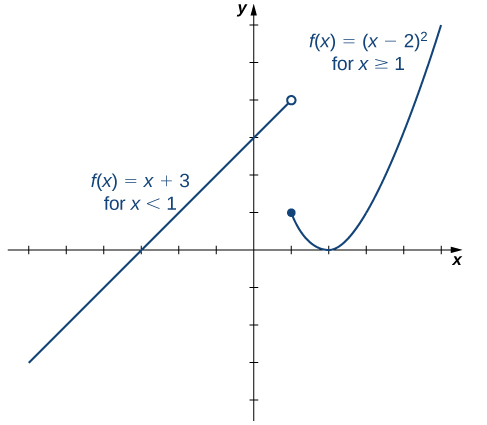
To sketch a graph of our example we graph the linear function on the interval and graph the quadratic function on the interval
Since the formula for a function is different for and we need to pay special attention to what happens at when we graph the function.
and this is different from the value we get when substituting into We thus draw an open circle at and a closed circle at to indicate the behavior of at on our graph.
-
Content in this page is adapted from OpenStax Calculus Volume 1 by Gilbert Strang and Edwin “Jed” Herman under the Creative Commons Attribution Noncommercial Sharealike 4.0 License.
Access for free at https://openstax.org/books/calculus-volume-1/pages/1-2-basic-classes-of-functions↩︎